The challenge
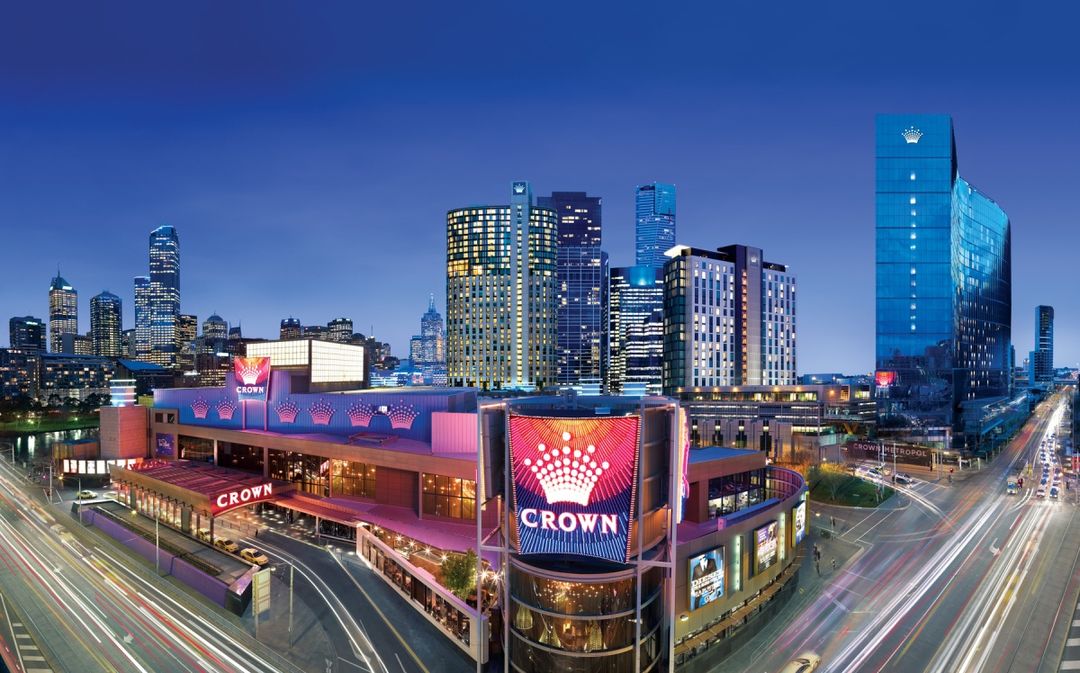
Crown Melbourne is one of Australia's largest integrated resorts, with three hotels and a podium that runs 24 hours a day. The 5,600 TR central chiller plant in this case study serves the podium. It was controlled by a Honeywell BMS using fixed sequence-of-operations logic.
Cooling load on the podium changes through the day with visitor numbers, events and weather. Fixed staging thresholds and condenser water setpoints do not follow those changes, so the plant ran less efficiently than it could, especially at part load.
Any operational disruption was unacceptable, and the savings had to be proven through measurement and verification.
Site profile
Verified results
Measured under IPMVP Option B
Savings were measured under IPMVP Option B, which isolates the chiller plant and meters its energy, over a 12-month reporting period that ended in June 2023. Carbon is converted at 0.87 tCO2e/MWh, the NGA Factors 2025 figure for Victoria (0.78 scope 2 plus 0.09 scope 3). Cost savings use an average tariff of $0.15/kWh.
| Outcome | Verified result | Status |
|---|---|---|
| Efficiency improvement | 12.3% improvement in chiller plant efficiency (kW/TR) | Verified |
| Annual energy reduction | 701,069 kWh per year | Verified |
| Carbon emissions reduced | 610 tCO2e per year | Verified |
| Annual cost savings | $105,160 per year | Verified |
Verified: measured under IPMVP Option B over a 12-month reporting period. Carbon is calculated from the verified kWh at the factor stated above.
The Exergenics approach
A strategy the site team implemented in the existing Honeywell BMS
Exergenics doesn't write to the BMS. Exergenics modeled the plant from its own trend data and issued the optimized strategy as a functional description. The site team implemented it in the existing Honeywell BMS in June 2022, with no downtime for the 24/7 operation.
Model the plant on its own data
Historical chiller, pump, cooling tower and energy meter trends came from the building's data warehousing platform. The site facilities team flagged plant constraints that don't appear in trend data.
Generate the strategy
Exergenics adjusted the modeling constraints based on site feedback, then generated optimized chiller staging thresholds and condenser water setpoints for the plant.
Implementation by the site team
The site team coded the strategy into the existing Honeywell BMS in June 2022 with no operational downtime. Exergenics has no write access to plant control. Savings were then measured under IPMVP Option B.