The challenge
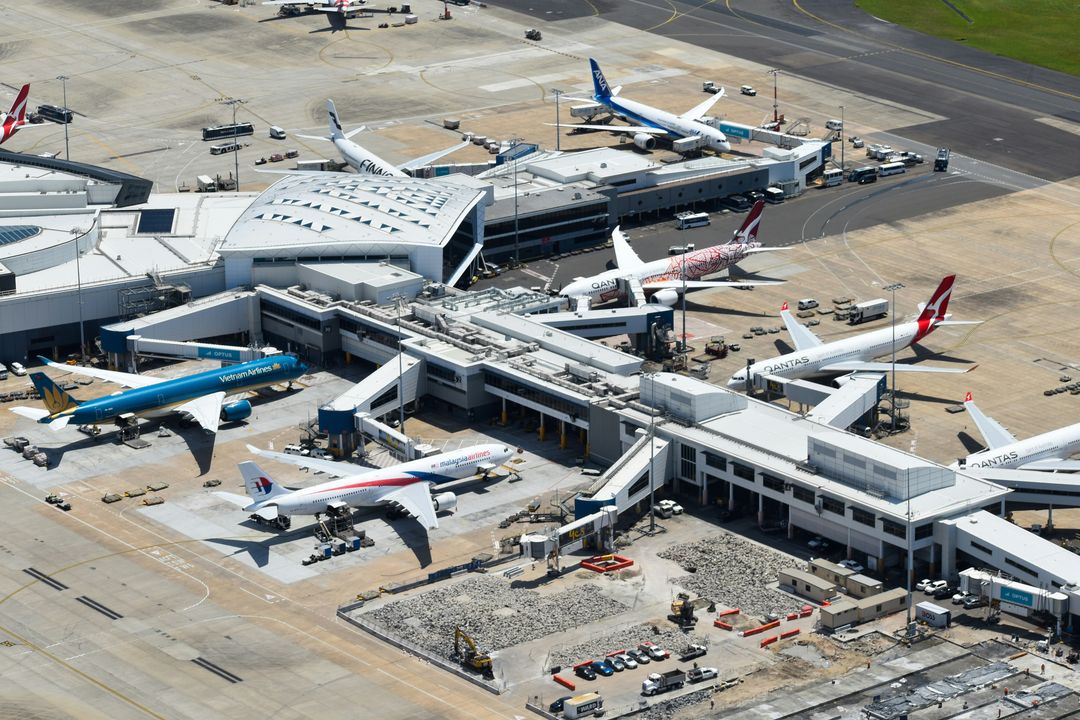
Terminal 1 is Sydney Airport's international terminal. It handled 17.17 million passengers in 2025, and its chilled water plant keeps terminals, gates and support areas comfortable through every flight schedule, weather event and occupancy surge.
The plant was already efficient before the project, operating at about 0.56 kW/TR (a COP of 6.25). The remaining opportunity was in the control logic. Conventional tuning relies on manufacturers' data as a proxy for how equipment performs, and real chillers, pumps and towers drift from that data as they age.
Sydney Airport's cybersecurity standards required the project to work from existing BMS data, with no connection to plant control and no disruption to airport operations.
Site profile
Verified results
Full-year results, as published by A.G. Coombs
These are A.G. Coombs' published figures for the project. The 33.4% efficiency improvement, 890,094 kWh and 704 tCO2 were measured over the first nine months. The annual figures below are the full-year result. Cost savings use $0.14/kWh (1,742,000 kWh × $0.14 = $243,880). All M&V followed IPMVP Option B.
| Outcome | Verified result | Status |
|---|---|---|
| Efficiency improvement | 33.4% increase in chiller plant efficiency (first nine months) | Verified |
| Annual energy savings | 1,742,000 kWh per year (full year) | Verified |
| Carbon emissions reduced | 1,377 tCO2 per year (full year) | Verified |
| Annual cost savings | $243,880 per year (full year, at $0.14/kWh) | Verified |
Verified: measured under IPMVP Option B through preliminary and final M&V, as published by A.G. Coombs.
The Exergenics approach
Optimized control logic, implemented by the incumbent controls contractor
Exergenics doesn't write to the BMS. A.G. Coombs Advisory led the project. Exergenics provided plant simulation and optimization from the airport's existing BMS data, and the incumbent controls contractor, Johnson Controls, implemented the optimized controls in the existing system.
Model the plant from existing data
Historical temperature, pressure, energy and flow data from the existing BMS trained models of each chiller, pump and cooling tower. The model was checked against historical data for simulation accuracy and energy and mass balance before any strategy was generated.
Generate the control strategy
The project team chose which controls to optimize. The optimization then set the values for secondary pump staging and flow reset, the chiller sequencing strategy, chiller stage-up and stage-down demand setpoints, and a stage-based dynamic condenser water temperature reset.
Implementation by the incumbent contractor
Johnson Controls coded the optimized controls into the existing BMS in March 2023. No hardware was added. Savings were then tracked through measurement and verification across the 12-month project.