A chiller is a twenty-year decision: A technical deep dive into retrofit equipment selection
A chiller is a twenty-year decision: A technical deep dive into retrofit equipment selection
How retrofit equipment gets chosen today, and how an operational model makes that choice a better one.
This month we are looking at retrofit equipment upgrades, and in particular how you choose a new chiller. It is one of the highest-stakes calls a plant owner makes. You live with the result for two decades, the upfront cost is large, and the running cost and emissions of the machine you pick will sit on your books every year until the next replacement. We will walk through how the decision is usually made, where mechanical consultants do excellent work, and where we think an operational energy and emissions model changes the answer.
The piece is focused on chillers, but the same approach applies to minor upgrades too. Adding variable speed drives to direct-on-line pumps, fans and motors, swapping out a cooling tower, re-sizing a pump set. Anywhere there is a capital choice with an energy consequence, the same modelling helps. Chillers are simply where the money and the lock-in are largest.
A retrofit is mostly a physical problem first
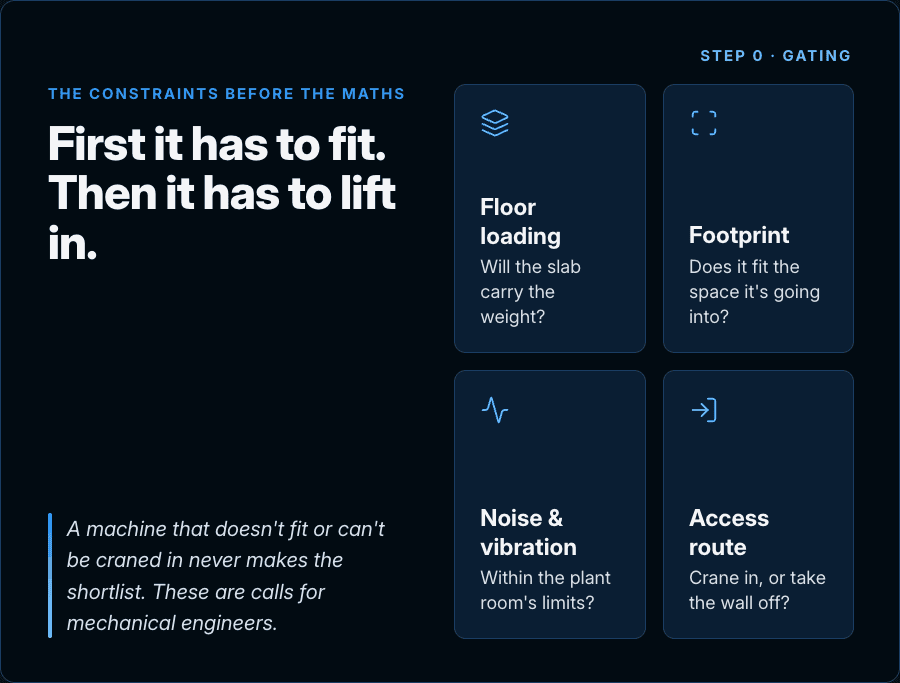
Before any of the energy maths matters, a retrofit has to clear a set of practical hurdles. What are the space requirements? Is there a weight limit on the slab? What are the noise and vibration constraints? And the one that catches people out: how do you physically get the machine into the building? Sometimes that means a crane. Sometimes it means taking the side of the building off.
These are not cost questions, and they are not energy questions. They are hard engineering constraints, and getting them wrong is expensive in a way no spreadsheet can recover. This is where mechanical consultants earn their keep. They understand the piping, the space, and the existing setup, and they specify a machine that will deliver the required chilled water temperature at the required load and operate safely within the plant. That work is detailed, site-specific, and not something a model replaces.
A note on right-sizing
There is a step that sits above equipment selection, and it is worth mentioning even though it is not the focus of this article.
Most chiller replacements are done on a like-for-like basis. A 1,500-ton machine comes out, and a 1,500-ton machine goes back in. It is the simplest approach, and, to some extent, an open secret in the industry that simplicity is often the reason it happens.
Sometimes a consultant will go further and look at the actual load profiles. Building use changes. Weather patterns shift. The rest of the plant may have been tuned and may be running more efficiently than it was when the original machine was specified. Once you study the peak demand day properly, there is often a real opportunity to right-size and save a lot of capital and energy at once. That is its own topic and another great application of simulation and forecasting, and we will come back to it. For the rest of this edition, assume the required capacity has already been determined. The question then becomes: which machine is the right one for the job?
What you get back from a manufacturer
So you go to the manufacturers. You tell them you need, say, a 1,500-ton water-cooled machine that hits a 42°F leaving chilled water temperature, and you ask for a quote. Two things come back: a capital cost, and an OEM spec sheet.
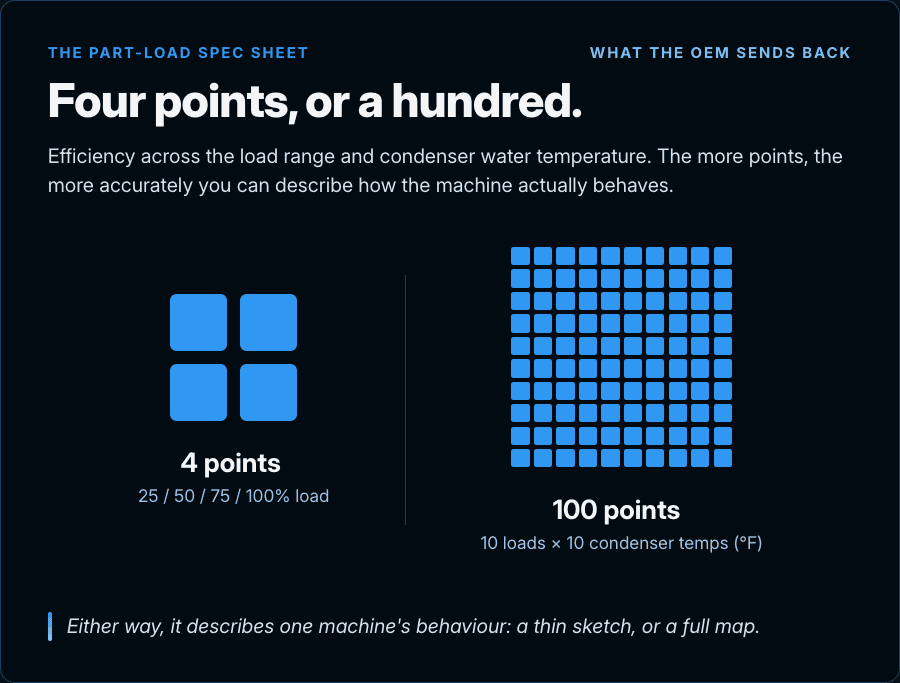
That spec sheet is the interesting part. Depending on the manufacturer, it contains anywhere between four and a hundred points of part-load efficiency data. At the lean end, four points: efficiency at 25, 50, 75 and 100 percent load at a single condenser water temperature. In the middle, efficiency in ten-percent increments across the load range. At the rich end, ten load increments across ten different condenser water entering temperatures. The more points you get, the more accurately you can describe how that machine actually behaves.
IPLV (Integrated Part Load Value) is a useful metric, but it’s only an average
The standard way to turn all those points into a single comparable number is the IPLV, the Integrated Part Load Value. It is the industry's one-number efficiency rating. It blends a chiller's efficiency at 100, 75, 50 and 25 percent load using a fixed set of weightings from an AHRI standard, on the assumption that a machine spends most of its life somewhere around half to three-quarters load.
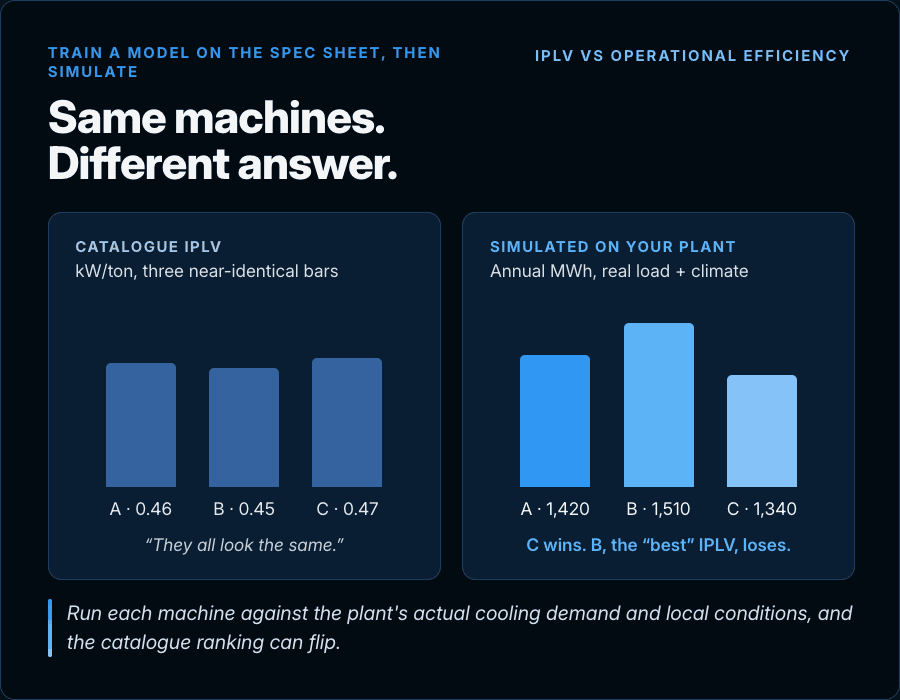
IPLV is a good standard, and if you cannot go any deeper, it is not a bad way to get an indication of annualised efficiency. But it is general by design. The weightings are an industry average, not your plant. They do not know your building's load profile, they do not know your local climate, and they do not know how the rest of your plant is operated. Two chillers with similar IPLVs can perform very differently once you drop them into a real site.
We train a model on the spec sheet
Here is what we do instead. We take the OEM part-load performance data and use it to build a full part-load efficiency curve for the machine. Conceptually, it is the same process we use when modelling an existing plant from historical telemetry. The difference is that, in this case, the model is trained on the manufacturer's published performance data rather than on operating trend logs. The more performance points available, the more accurately we can represent the machine. With fewer points, the model becomes coarser, but the outcome is the same: a performance model that predicts how that specific machine behaves across its operating range.
Now we can simulate. Take a shortlist, say a York, a Trane and a GeoClima, and instead of comparing three IPLV numbers, we run each machine against the plant's actual cooling demand and local conditions. Out comes an operational kW per ton, and from there the kilowatt-hours per year you would actually use with each machine. That is an operational efficiency figure, grounded in how the plant really runs, rather than a catalogue average.
Now the trade-offs turn into numbers
Once you have annual energy for each option, the decision stops being a feeling and becomes arithmetic. The old machine is at end of life, so its capital cost is sunk. What matters is the incremental capital cost between the candidates. Does spending an extra $200,000 on a more efficient machine make sense? With an operational energy model, you can answer it directly. Put the incremental capital cost over the annual operating savings, and you get a simple payback. If the more efficient machine pays itself back in four years and then runs for another sixteen, the extra spend is easy to justify.
Emissions are part of the same model
The same machinery handles emissions, and this is where it earns its place. Take two versions of the same chiller, one with a standard refrigerant and one with a low global warming potential refrigerant. With an assumed leakage rate, you can model and compare scope one, two and three emissions across both, and weigh them against the difference in energy efficiency.
That matters because plants increasingly carry hard targets. A NABERS rating, a Green Mark target, Local Law 97 in New York, an organisational net zero commitment. Whether you already buy green power, or plan to transition to a fully renewable electricity supply, changes the economics as well. Each scenario can be modelled and forecast, allowing you to calculate the marginal abatement cost of every option. In other words, the cost of removing one tonne of CO₂. Once you have that number, you can compare and rank machines and system configurations on a like-for-like basis.
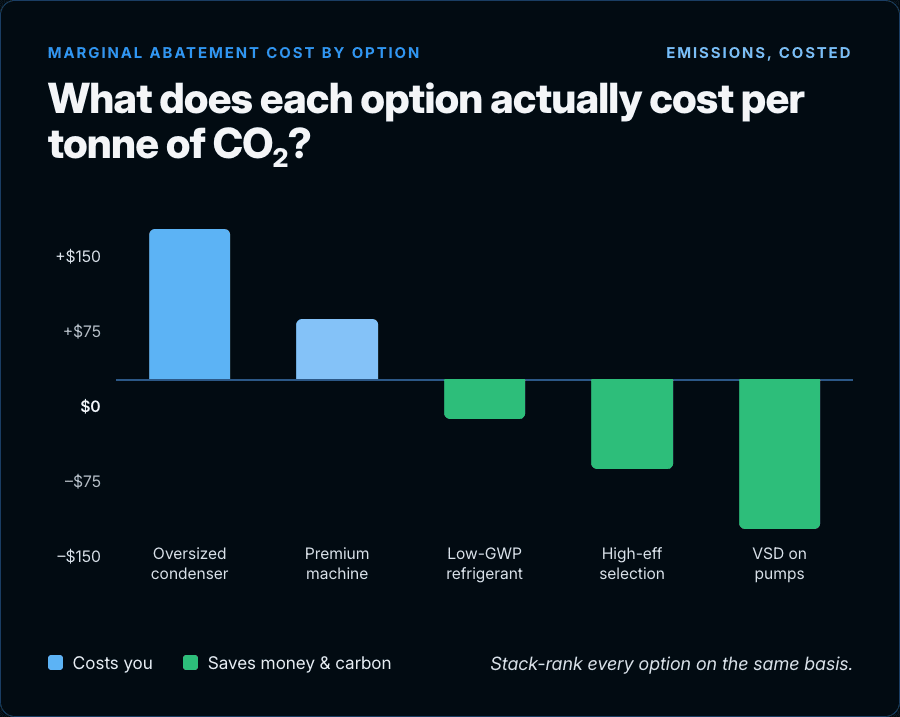
There is an important subtlety here. As a site moves to green power and de-gasifies, its electricity emissions fall, and the fugitive emissions from refrigerant leakage become a much larger share of the total carbon footprint.. So the optimal choice can flip over the life of the asset. A machine that looks worse on energy today can be the better long-term choice once you account for where the grid and the organisation are heading. That is exactly the kind of forward-looking, what-if question this modelling is built to answer.
The rubric, and where we go further
Consultants usually turn to a scoring rubric.
The first step is gating. To make the shortlist at all, a machine must satisfy a set of minimum technical and operational requirements. Once that shortlist is established, the remaining options are scored against a series of weighted criteria such as capital cost, IPLV, refrigerant type, expected emissions, maintainability, and other project-specific considerations.The scores are combined, the weightings are applied, and the highest-ranked machine becomes the recommendation.
Where we go further is everything after the gate. A fixed rubric incorporates one set of weightings, but the right weightings are not universal. They are a statement of the organisation's strategy. How should you weigh upfront capital against operating cost? A commercial REIT and an owner-operator university or hospital can land in completely different places on that question. What is the emissions strategy, and how does it interact with green power plans and net-zero dates? Those are strategic inputs, not fixed coefficients. A model lets you set them explicitly, change them, and run the sensitivity rather than collapsing everything into one weighted score.
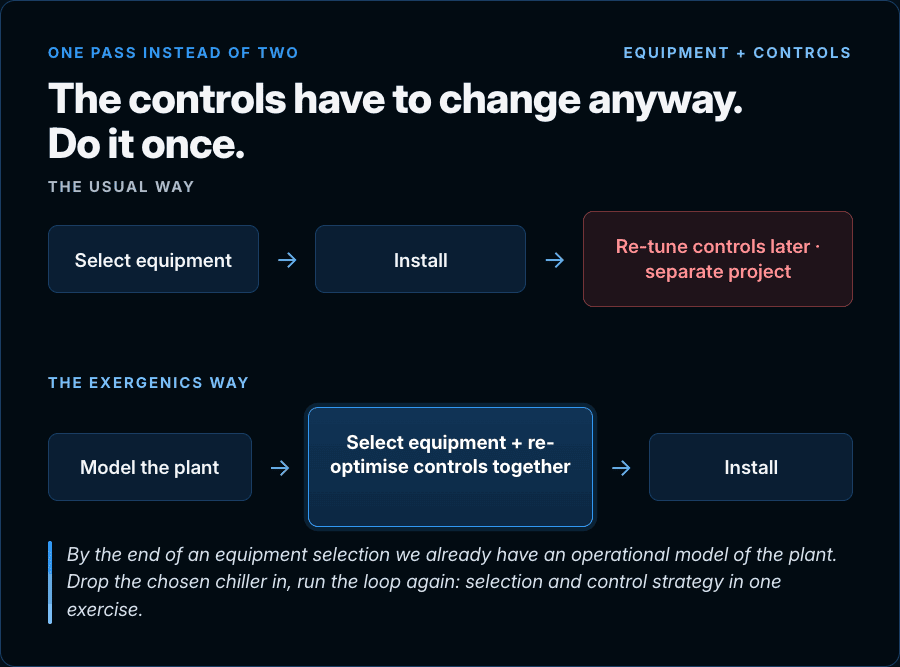
Upgrade the plant and the controls in one pass
This is where the deployment model matters. The control logic is static. It does not change. It has been computed during pre-training, regressed and written into the controller. There is no cloud connection, no gateway, no live agent sitting in the loop. But the control is dynamic. The setpoint resets continuously, every minute of every day, based on what is actually happening at the plant: which chiller(s) are running, what the load is doing, and what the wet bulb is outside. Operators can read the algorithm, interrogate it, and see exactly why the plant is behaving the way it is. It is dynamic optimisation living on the edge, with no black box.
That is the trick. Solve the hard problem offline, once. Hand the plant a small set of readable algorithms that reproduce the answer in real time. Wet-bulb plus 4-8°F is a sensible default. What we deliver is a setpoint policy that respects the physics inside and the reality of controls outside.
Exergenics can help model the operational energy, cost and emissions of your plant before you commit to any new equipment.
Curious to see more?
This is the part that de-risks the decision. You are going to live with this machine for twenty years. We have all seen the other version of the story. A poor equipment choice gets made once, and the consequences are locked into the plant for decades. The machine underperforms, energy costs stay higher than they should, and everyone waits for the day the CFO finally approves a replacement. Modelling the operational energy, cost and emissions before you commit is how you avoid being that story.
If you select equipment differently, or you are a consultant with a view on any of this, we would like to hear it. Send us a message. We read every one.
Iain Stewart
Cofounder & CEO, Exergenics